Speed analysis: top speeds by time, distance and Alpha
Available for: Windsurfing, kitesurfing, wingfoiling, parawing, sailing, windfoiling, kitefoiling, landsailing, pump foiling
Updated on
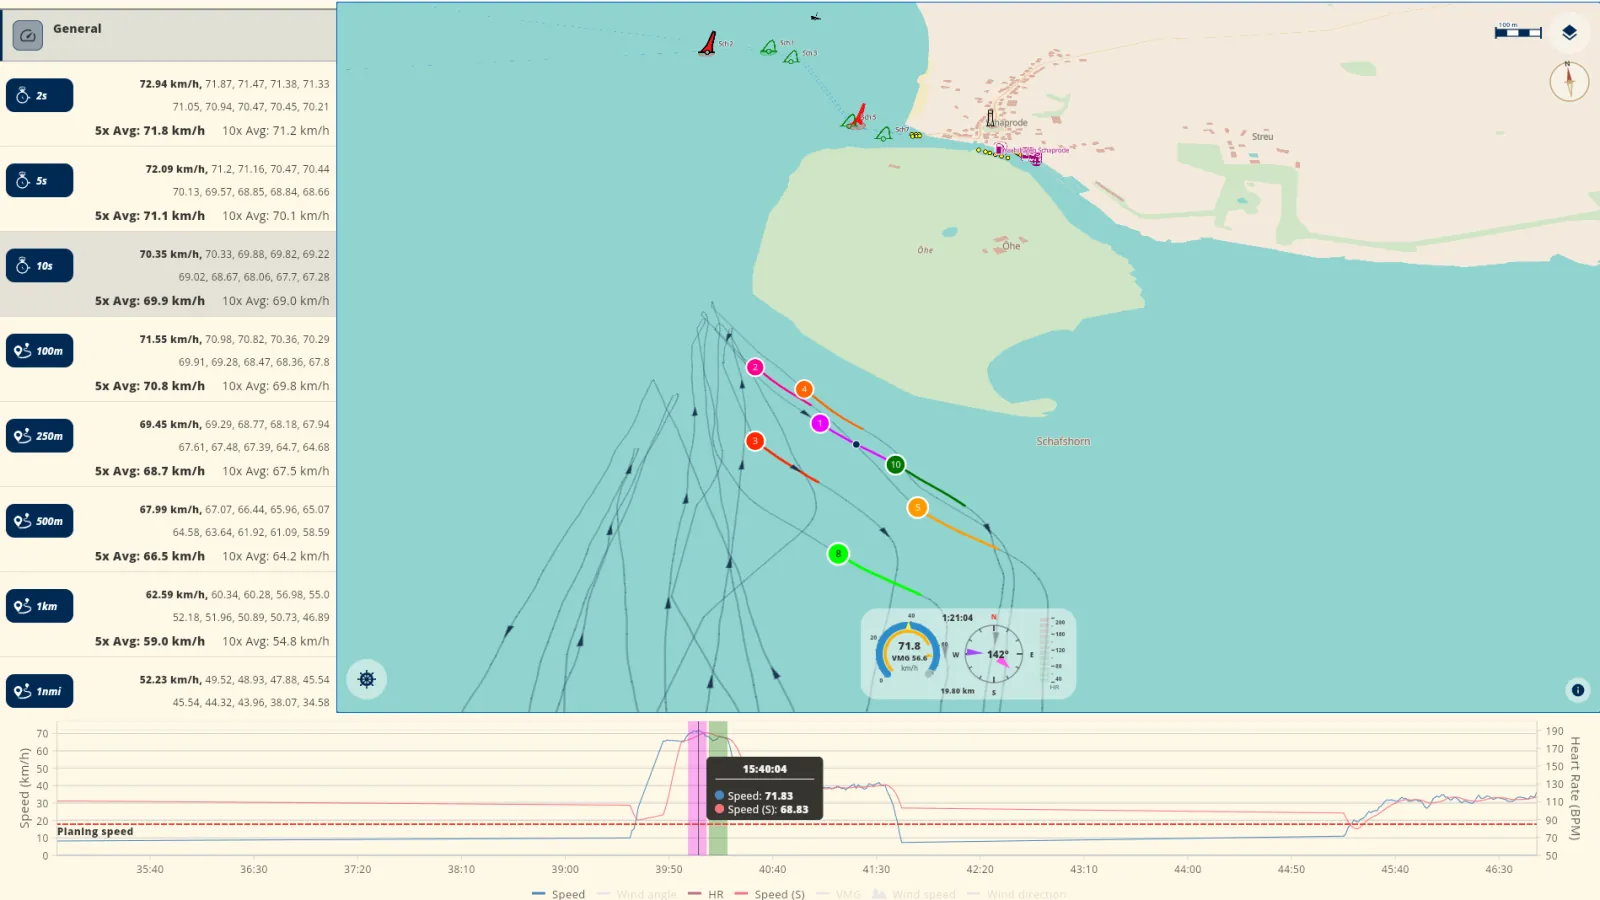
One top speed does not tell you much about a session. A 2-second peak can come from one gust. A good 500 m value or a good 1-hour value shows that you can keep a high speed. WindSportTracker calculates your top speeds by time, by distance and as Alpha runs. You can select each run and examine it on the map and in the speed chart.
For each speed value, the app also shows the average of your 5 and 10 best runs. Filters show the same values for upwind runs, for VMG, for port and for starboard.
During the 27-day trial, all functions are available. You can do a test of the speed analysis with your sessions before you buy a subscription.


The speed values
The app calculates these speed values for each session:
| Type | Speed values |
|---|---|
| Time | 2 s, 5 s, 10 s, 30 min, 1 h, 12 h, 24 h |
| Distance | 100 m, 250 m, 500 m, 1000 m, 1 nautical mile (1852 m) |
| Alpha | Alpha 250, Alpha 500, Alpha 1000 |
Speed by time
A speed value by time is the highest average speed during this time. The 2 s value is the top speed of the session. It is more accurate than a 1-second peak, because one GPS sample can have an error. The algorithm also removes GPS samples that are not possible. Thus, one bad sample does not become your top speed.
The values for 5 s and 10 s show the speed that you keep on a short run. The values for 30 min and 1 h show your speed during a long time, which includes maneuvers. The values for 12 h and 24 h are for very long sessions.
Speed by distance
A speed value by distance is the highest average speed on this distance. The short distances show the speed on one run. From about 1000 m, a run can include a maneuver. Then the result also shows how much speed you keep in the maneuver. The nautical mile (1852 m) is a usual distance in GPS speed rankings.
Alpha 250, Alpha 500 and Alpha 1000
An Alpha run is a run out, a jibe and a run back. The start and the end of the run can be a maximum of 100 m apart. The number is the maximum total length of the run in metres:
- Alpha 250: about 125 m before and 125 m after the jibe.
- Alpha 500: about 250 m before and 250 m after the jibe.
- Alpha 1000: about 500 m before and 500 m after the jibe.
A shorter run can also be the result. For example, an Alpha 1000 result can be a run of 600 m, if this run is faster than all longer runs. Usually, the longer run is faster, because you have more distance to increase your speed.
Alpha shows more than the straight-line speed. You must select a good course on the run out, jibe at high speed and increase your speed again on the run back.
5x and 10x averages
For each speed value, the app shows the best run. It also shows the average of the 5 best runs (5x) and of the 10 best runs (10x). The runs in an average do not overlap.
One good run can come from one gust. A good 5x or 10x average shows that you can get the same speed again and again. GPS speed rankings also use averages, for example the average of 5 runs of 10 s.
If a session does not have 5 runs for a speed value, the app does not show a 5x average for this value. The same rule applies to the 10x average.
Filters
Filters show the same speed values for a part of your runs. The app has these filters:
- General: All runs of the session.
- 1 Leg: Only the best run of each leg (a straight run between two maneuvers). Thus, the 5x average comes from 5 different legs.
- Upwind: Only runs upwind.
- VMG Up and VMG Down: The same time and distance values for your speed upwind and downwind (VMG).
- Port and Starboard: Only runs on port or only runs on starboard.
There is no downwind filter, because downwind runs are usually the fastest runs. Thus, the General list includes these runs. With the Port and Starboard filters, you can compare your two sides.
Personal bests
The app keeps your all-time personal best for each speed value. It also shows your previous all-time personal best. Thus, you can see how much faster your new personal best is.
You can also find your best values for a specified selection. Filters for the statistics are time, sport, discipline, labels, equipment and some base metrics. You can use all of these filters together. For example, you can find your best 500 m value of this year with one sail.
Map and speed chart
When you select a run, the app shows its section on the speed-colored map. The speed chart shows the same section second by second. You can zoom the speed chart. Thus, you can see if a peak came from a gust, from a good course or from an error in the GPS data.
Compare two runs on the map. You can see if a different course or a different position on the water gave a higher speed.
During the session
The phone and watch apps tell you your speed with a voice. On Apple Watch and Wear OS, the watch also gives a vibration when you get a new top speed for the session. Thus, you know during the session if a change of course or equipment makes you faster.
Record and import
The speed analysis is available for all sessions in the applicable sports. The device that recorded the session is not important.
- iPhone, Android, Apple Watch and Wear OS: These devices record directly with WindSportTracker.
- Garmin, Coros, Suunto and Polar: After you connect the account one time, these watches send new sessions to WindSportTracker automatically.
- Locosys GT11, GT31, GW52 and GW60: You can import SBN and SBP files from these GPS devices.
- Other formats: Imported sessions get the full analysis, which includes the speed analysis.
More information about devices and import is in compatible devices. The 2 second speed guide tells how GPS measures short speed values.
Questions and answers
What is the difference between the 2 s value and the 10 s value?
The 2 s value shows your peak speed, for example in one gust. The 10 s value shows the speed that you can keep on a short run. A small difference between the two values shows that you keep your speed.
What is Alpha 500?
An Alpha run is a run out, a jibe and a run back. The number is the maximum total length in metres. Thus, Alpha 500 has about 250 m before and 250 m after the jibe. The start and the end of the run can be a maximum of 100 m apart.
Why does a session not show a 5x or 10x value?
The 5x value is the average of the 5 best runs, and the 10x value is the average of the 10 best runs. If a session does not have this number of runs for a speed value, the app does not show the average.
What does the 1 Leg filter do?
A leg is a straight run between two maneuvers. The 1 Leg filter uses only the best run of each leg. Thus, the 5x and 10x averages come from 5 or 10 different legs.
Try the speed analysis
During the 27-day trial, you can use the speed analysis with your sessions. After the trial, WindSportTracker costs €2.70 each month or €27 each year when you pay in the web app. The price can be different in other currencies and because of taxes.