Wingfoil app GPS tracking: flight time, speed, maneuvers
Updated on
After the start, one thing counts on the water: Do you stay up, or does the foil drop again? In wingfoiling the highest speed is not the only measure of a good session. Just as important is how long you fly, whether you bridge wind holes on the foil, and whether your maneuvers interrupt the flight. A wingfoil app that only stores distance and top speed leaves those questions open. WindSportTracker answers them.
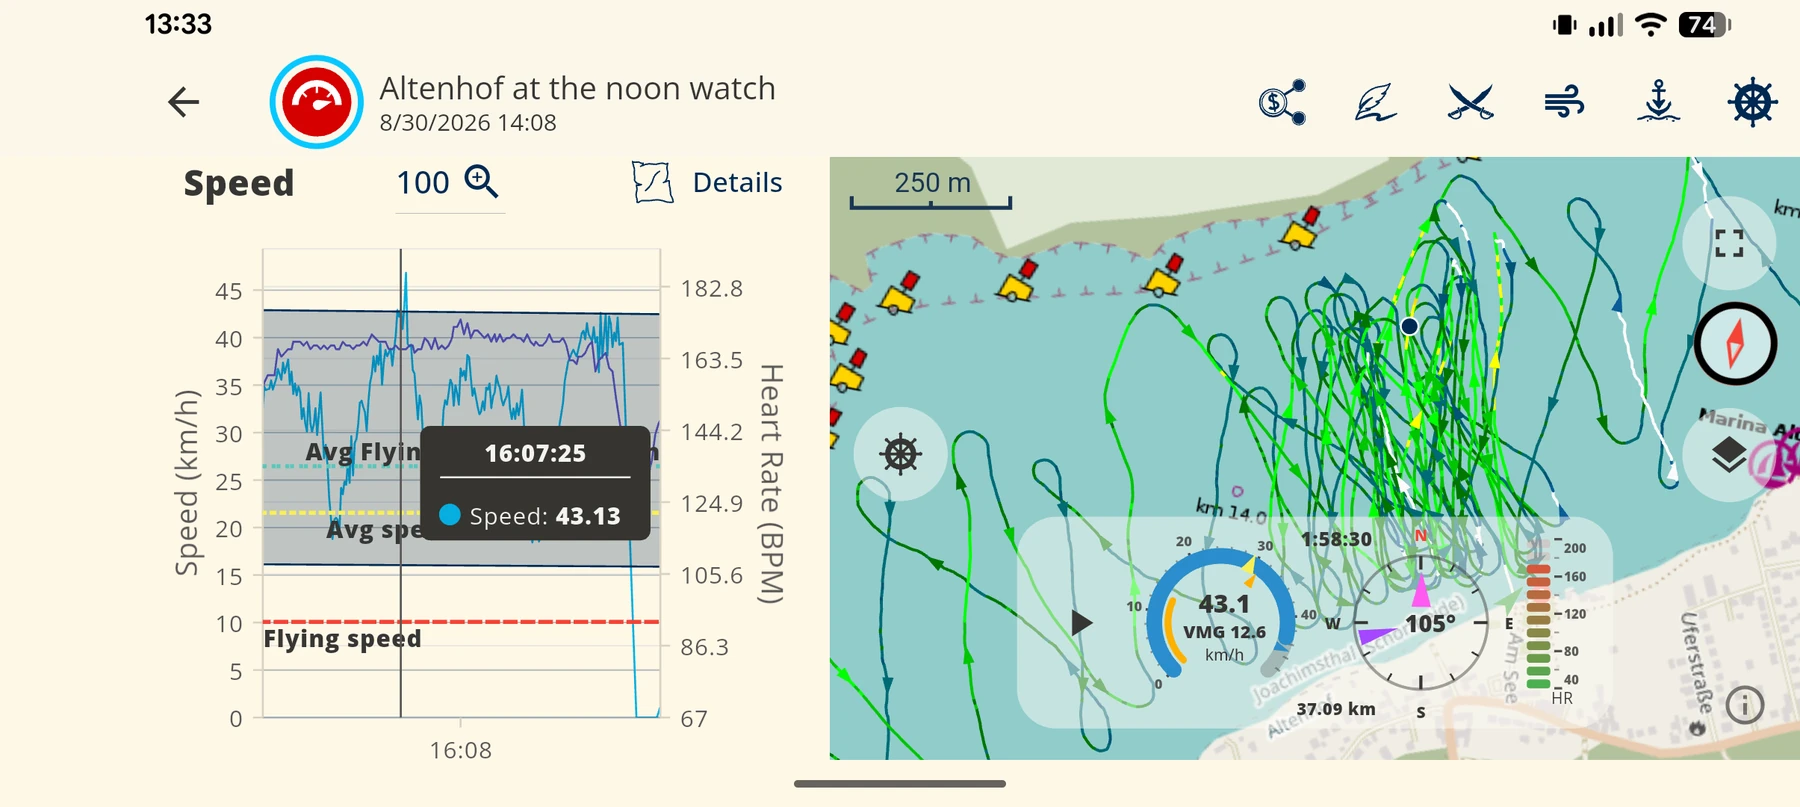
WindSportTracker distinguishes flight phases, displacement sailing and pauses. The same principle applies to the further analyses: Was a maneuver foiled through, only partially foiled, or did it end in a crash? Did you stay on the foil during a wave ride? On the session map, flight phases are visible in color; within the track the color also changes with speed. In the zoomable chart the matching time spans are marked as ranges. You can therefore see where a long flight began and ended and how speed developed inside it.
For recording, an iPhone or Android phone in a waterproof case is enough. Alternatively you record directly with Apple Watch or Wear OS, or you transfer a session from Garmin, Coros, Suunto or Polar. During the 27-day trial the full feature set is available, without you having to enter payment details.




What the wingfoil app measures
In wingfoiling you accelerate at first as well. The real goal, though, is the transition into the flight phase and then staying up. Depending on gear and conditions you start actively by pumping with wing, board and foil. With enough wind or a large enough front wing the foil can also begin to carry without a pronounced pump movement. After that it matters that you do not lose the flight phase again immediately.
On windsurfing WindSportTracker describes the comparable performance state as planing time. In wingfoiling, flight time and flight ratio are at the centre. Shared analyses such as speed intervals, Alpha 250, jibe quality, VMG and polar diagram still remain. The two sports therefore use the same terms where the same thing is actually measured, and different terms for their own riding states.
Flight time and flight ratio
Flight time is the sum of all intervals in which the algorithm detects a flight phase. The flight ratio puts that time in relation to the full session duration. At a flight ratio of 40 percent you therefore spent 40 percent of the recorded time on the foil. For the remaining time WindSportTracker distinguishes displacement sailing and pauses. A pause appears, for example, after a crash while you get back on the board, or when you wait for the next gust.
Besides time, the distance covered is also broken down by these states. You can therefore see whether a low flight share came mainly from long pauses or from many stretches in displacement. Two sessions with the same flight ratio can have felt very different on the water and therefore call for different conclusions.
For beginners the first goal is to get onto the foil reliably at all and to lengthen the first flight phases step by step. Advanced riders try to connect several tacks through foiled-through maneuvers into one uninterrupted flight. Experienced riders additionally work on becoming faster and staying up even when the wind drops briefly. The same metric therefore accompanies different learning stages without reducing them to a single record value.
Longest flight phases in distance and duration
You find the longest connected flight phases in the distance and duration details. There it is not only about how fast you were for a few seconds, but how long and how far you stayed on the foil without interruption. Especially on gusty days a long flight shows whether you could bridge missing wind by pumping and save yourself until the next gust.
This analysis also helps when you ride downwind. Perhaps you manage to connect two downwind runs without ending the flight in between. If the flight ends earlier, you can inspect the section on the map and in the chart: Was a crash the cause, did the chosen angle not match the wind, or was too much speed lost in the maneuver? The app gives you the time series and the spatial path; you place the riding cause from your session.
Jibes, tacks and 360s
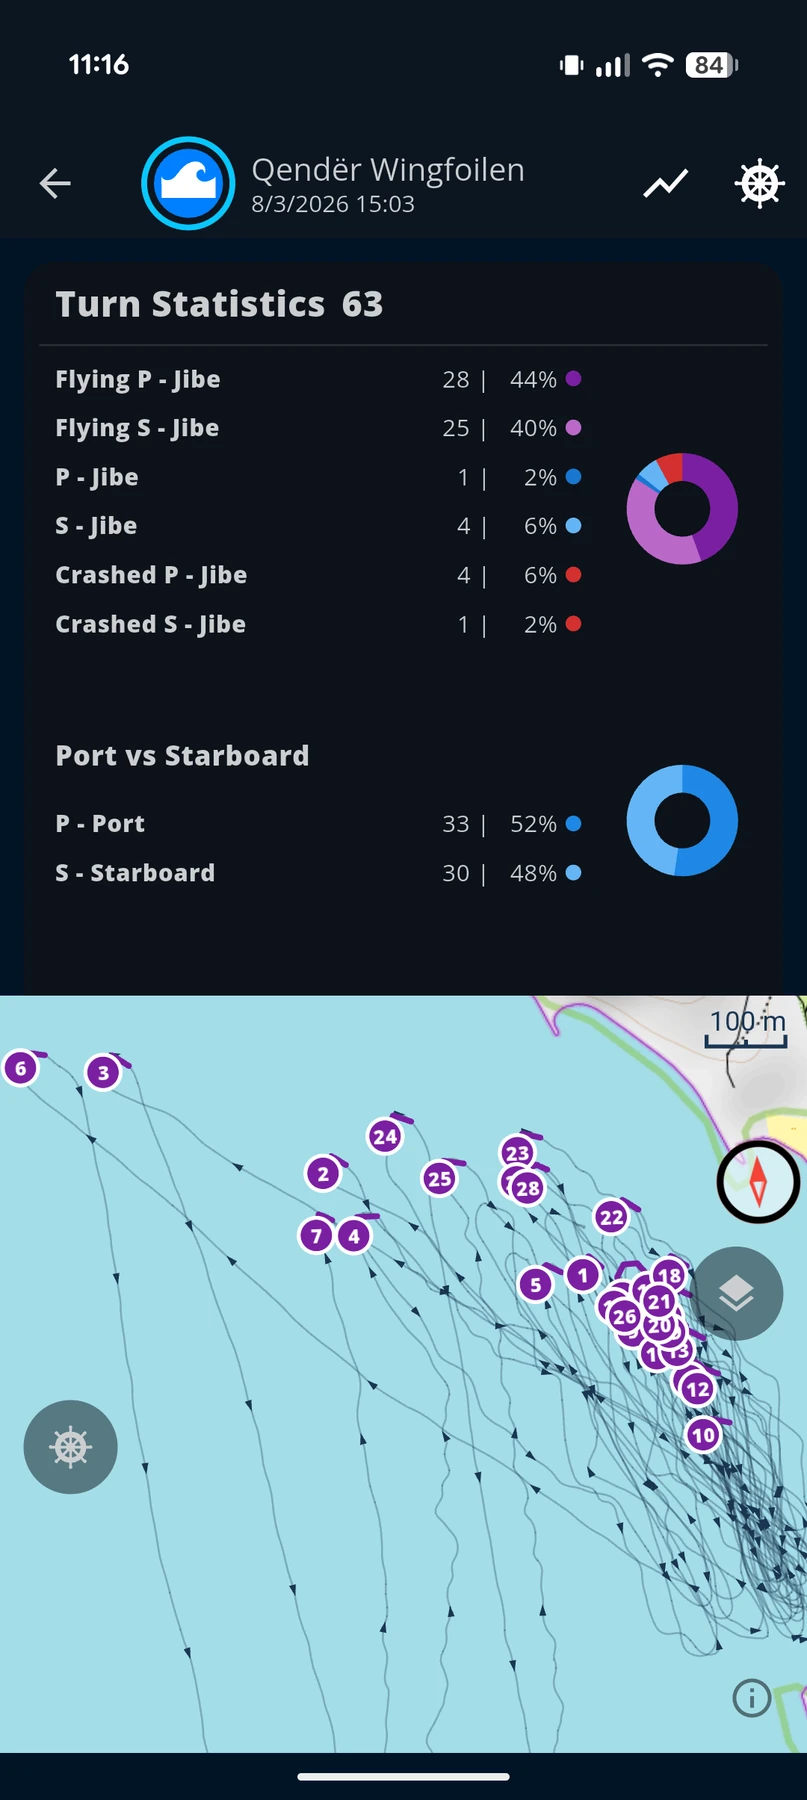
WindSportTracker detects jibes and tacks in a sport-specific way for wingfoiling. In the assessment the app distinguishes foiled through, partially foiled and crashed. The same split is used on the windsurfing page with “planing through”, “partially planing” and “not planing through”. The analysis principle is the same, the riding state stays named for the sport.
The separate analysis by port and starboard shows on which side your maneuvers work more reliably. You can select individual jibes and check how high the entry speed was, where you became slower in the curve, and how quickly you accelerated again on the new course. A general success rate therefore becomes a concrete starting point for the next session.
360s are recognised as their own maneuver and are not booked as a jibe or a tack. That is especially important when you train rotations: a full course change alone does not yet say which maneuver you actually rode.
Speed and Alpha 250
The speed analysis in wingfoiling uses the same supported time and distance intervals as in windsurfing. That includes short values such as 2 and 10 seconds as well as longer distances and time spans. A short top speed shows what was possible in a gust. Longer intervals answer how stably you could hold speed, course and flight phase.
Alpha 250 is also available for wingfoil sessions. A valid run connects about 250 metres before and 250 metres after the maneuver; start and end may be at most 100 metres apart. Approach, maneuver and acceleration on the new course therefore flow into one shared value. A fast straight alone is not enough.
Wingfoilers and windsurfers can therefore compare their speed values on the same basis. Good wingfoilers now reach similar peaks to good windsurfers: one group flies on the foil, the other rides on the fin. For your own development it is still usually more important whether you can hold high speed repeatably and connect it with a foiled-through maneuver.
VMG, polar diagram and shifting wind
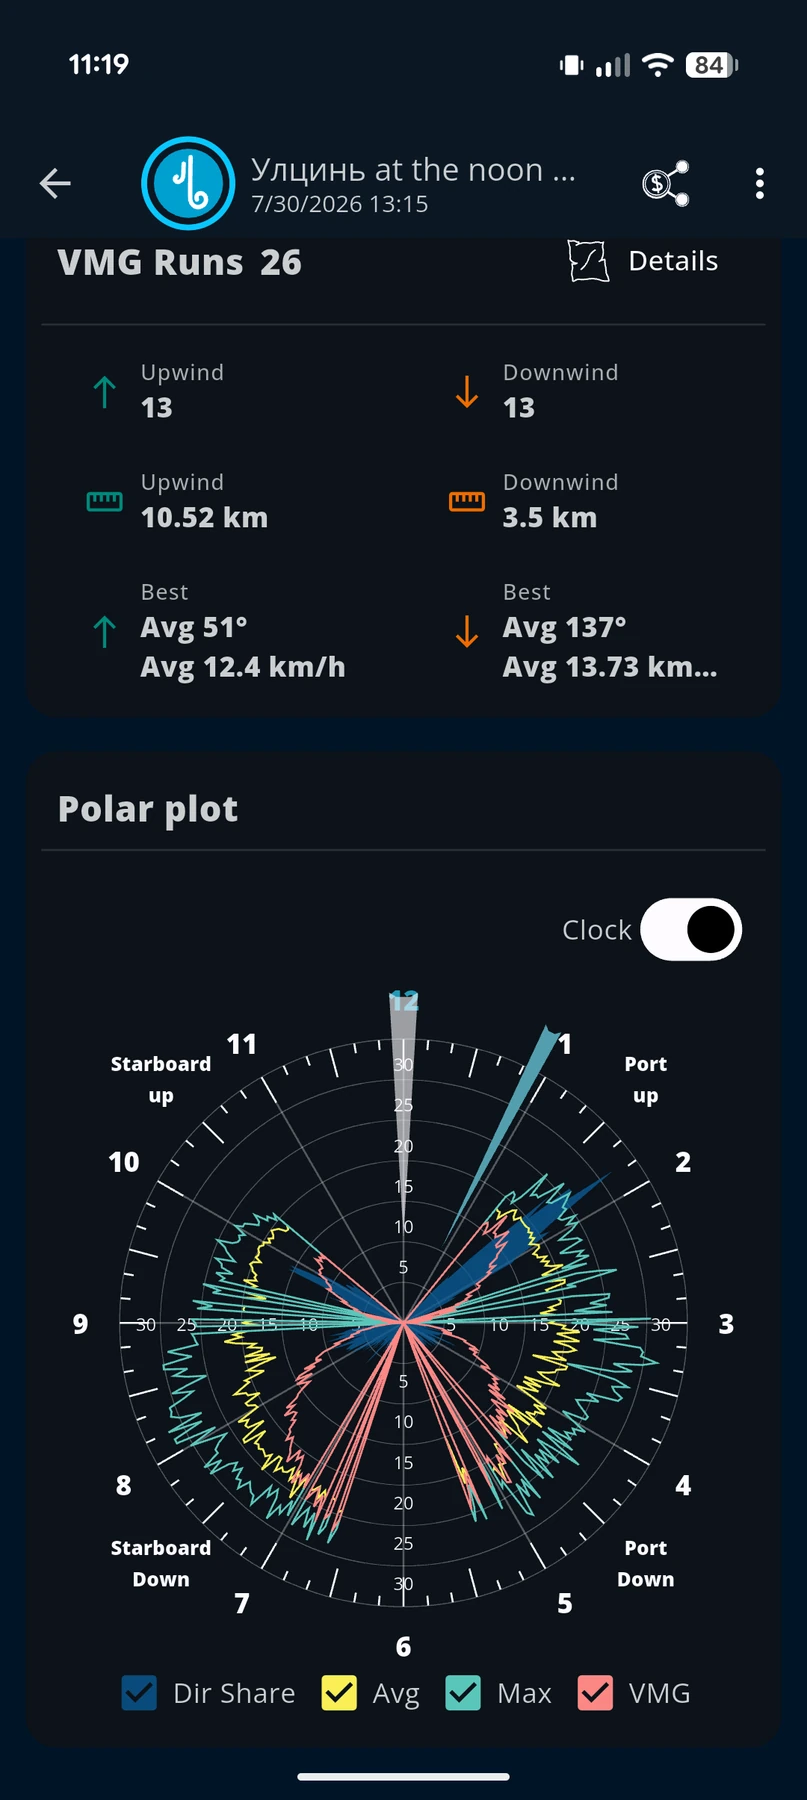
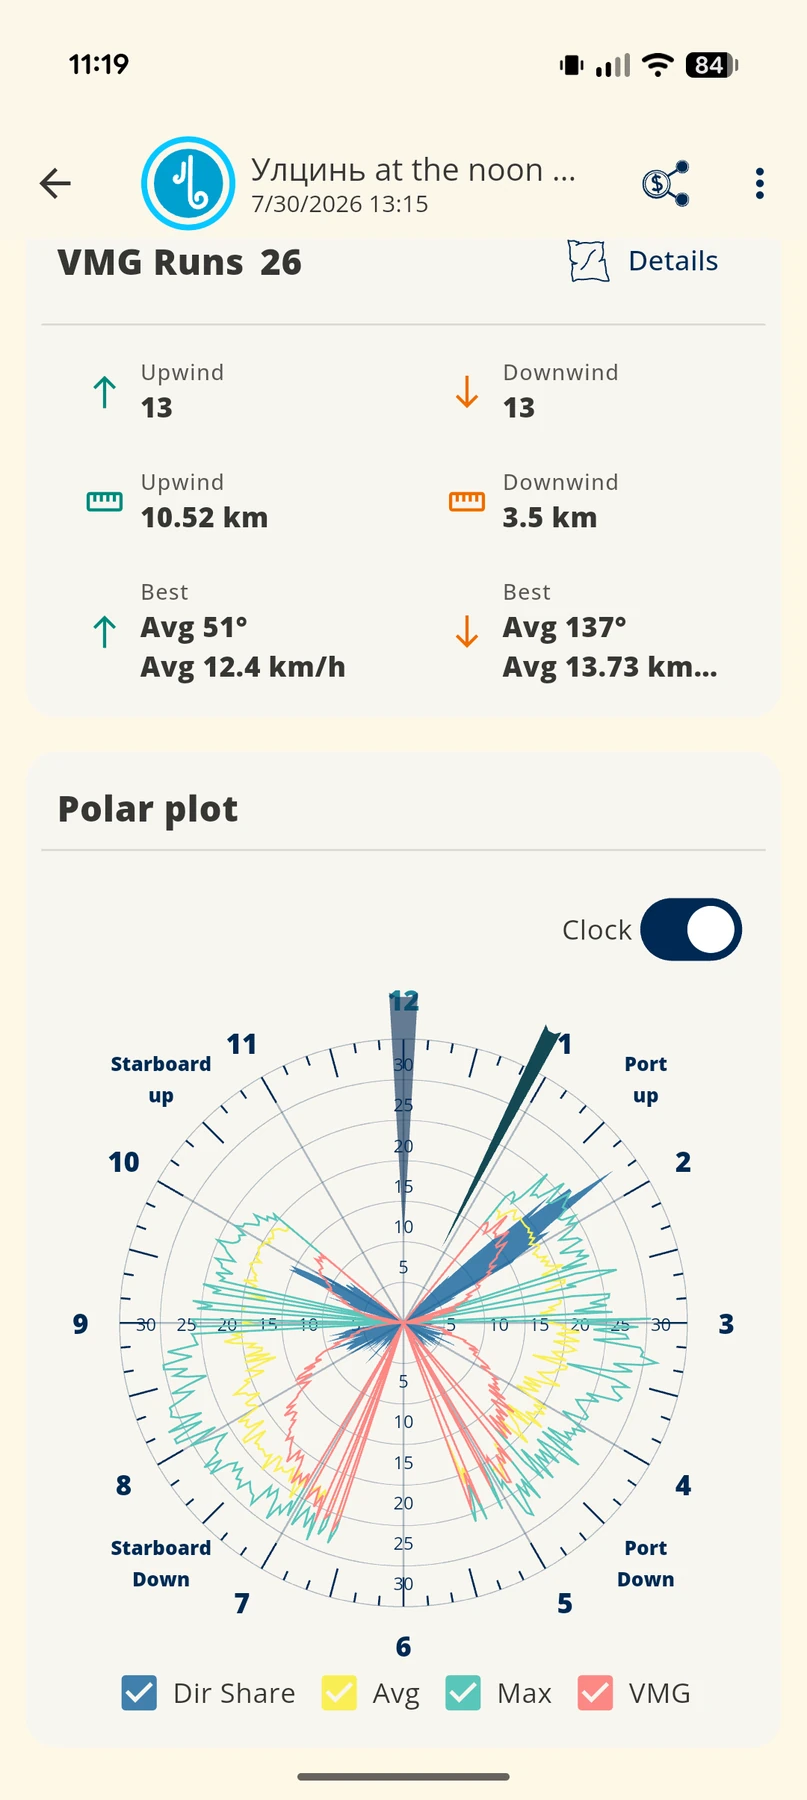
VMG shows how fast you actually move upwind or downwind. The steepest angle is not automatically the most efficient: a slightly freer course can create more speed and therefore get you to the imagined target in the wind direction faster. Individual upwind and downwind runs can be selected and viewed together with course angle and speed.
WindSportTracker accounts for the wind direction changing during a session. That matters for longer wingfoil sessions, because otherwise a run at the start would be scored against the same assumed direction as a run several hours later. The polar diagram shows your performance across different angles to the wind and helps you recognise efficient course ranges. Shown as a wind clock, it makes those course shares easy to read.
Wave rides during the flight phase
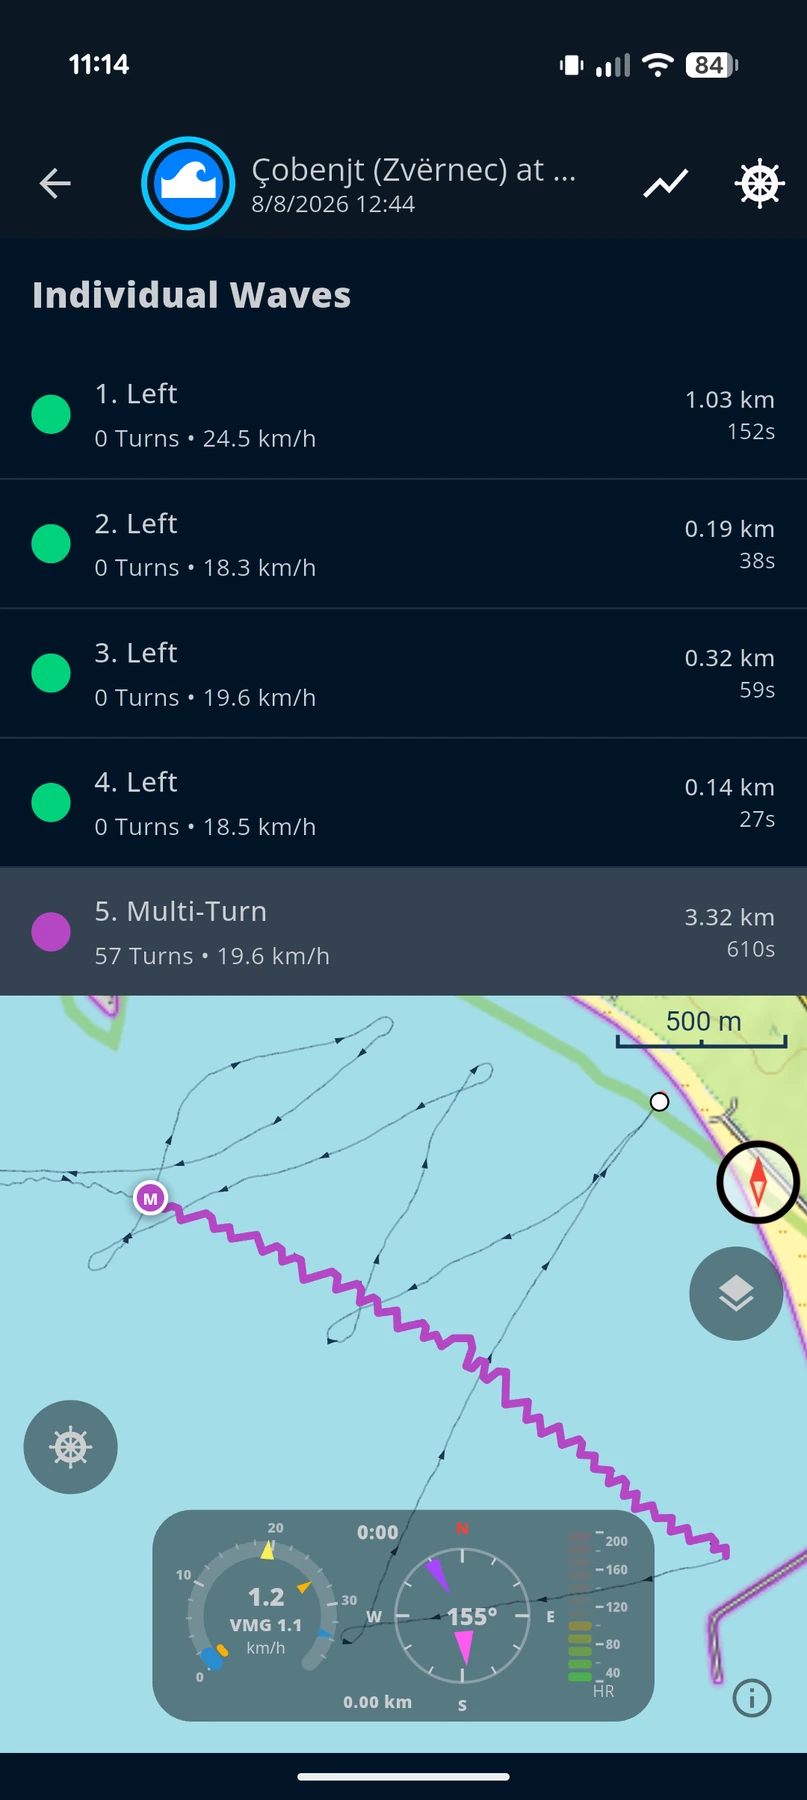
With a matching wave discipline WindSportTracker analyses the number, duration and distance of your wave rides. Here too the flight phase remains decisive: you see which wave rides you held on the foil and where the flight phase ended. You can therefore compare not only the number of your waves, but also inspect how long you connected and controlled a wave.
Map, replay and chart
The speed-colored session map shows where you rode and how your speed changed along the track. Flight phases are made visible as well. Spatially you therefore see whether you left the flight in the middle of a wind hole, before a maneuver, or only on a new course.
In the zoomable chart the flight phases are marked as time ranges. Further values such as speed, VMG, wind and heart rate can be viewed in the same time context. When you select a maneuver, a speed run or another analysis value, you can inspect the matching path in a targeted way. The replay complements both views and follows the session along the track.
Setup guides: Apple Watch and Wear OS. Feature overview on the homepage.
On your watch and with other devices
In wingfoiling, wet hands and a phone that is hard to reach are normal. You can therefore choose the device that fits your setup on the water. After the transfer the track goes through the same wingfoil analysis, regardless of whether it was recorded directly in WindSportTracker or with another supported device.
- Apple Watch and Wear OS: The WindSportTracker app records directly on the watch. During the ride, spoken speed feedback and a vibration alert on a new session top speed are available. Details are in the Apple Watch guide and the Wear OS guide.
- iPhone and Android: Both platforms record directly with WindSportTracker. The phone can stay protected in a waterproof case or pocket.
- Garmin, Coros, Suunto and Polar: After a one-time link, new sessions are transferred to WindSportTracker automatically. Guides are in the posts on Garmin, Coros, Suunto and Polar.
- Amazfit, Huawei, Xiaomi and Fitbit: If your watch can export GPX, you can import the file into WindSportTracker. That is not an automatic sync; what matters is the exported GPS track.
- Further files: Supported FIT and TCX files can also be imported and then analysed with flight, maneuver and speed analyses.
The device choice therefore stays separate from the later analysis. You can, for example, record directly with a Wear OS watch and still inspect an older GPX session from another system in the same season statistics.
Compare your gear
Wingfoiling depends strongly on the setup. A large front wing can carry early and enable longer flight phases in light wind, while a smaller front wing can be aimed at speed and control in stronger conditions. Board volume, wing size, mast, front wing and stabilizer together influence how the setup starts and behaves in flight.
In WindSportTracker you assign as many gear components as you like to a session. Besides wing, board, mast, front wing and stabilizer you can also capture freely defined parts or settings. That includes shims, for example, with which you change the angle of attack on the foil. Not only which foil you rode is stored, but also in which trim.
The gear statistics connect the setup with flight time, flight ratio, speed, maneuvers and further session values. In comparable conditions you can therefore check whether a different shim setting enables longer flight phases, whether a front wing carries better through wind holes, or whether a particular stabilizer steadies your foiled-through jibes. Wind and riding skill remain important factors; recurring differences still become visible across several sessions.
You can mark borrowed gear accordingly. Sold components are archived, but stay linked with their earlier sessions and statistics. The development of your setup is therefore not lost just because a part no longer belongs to your current equipment.
Long-term analysis
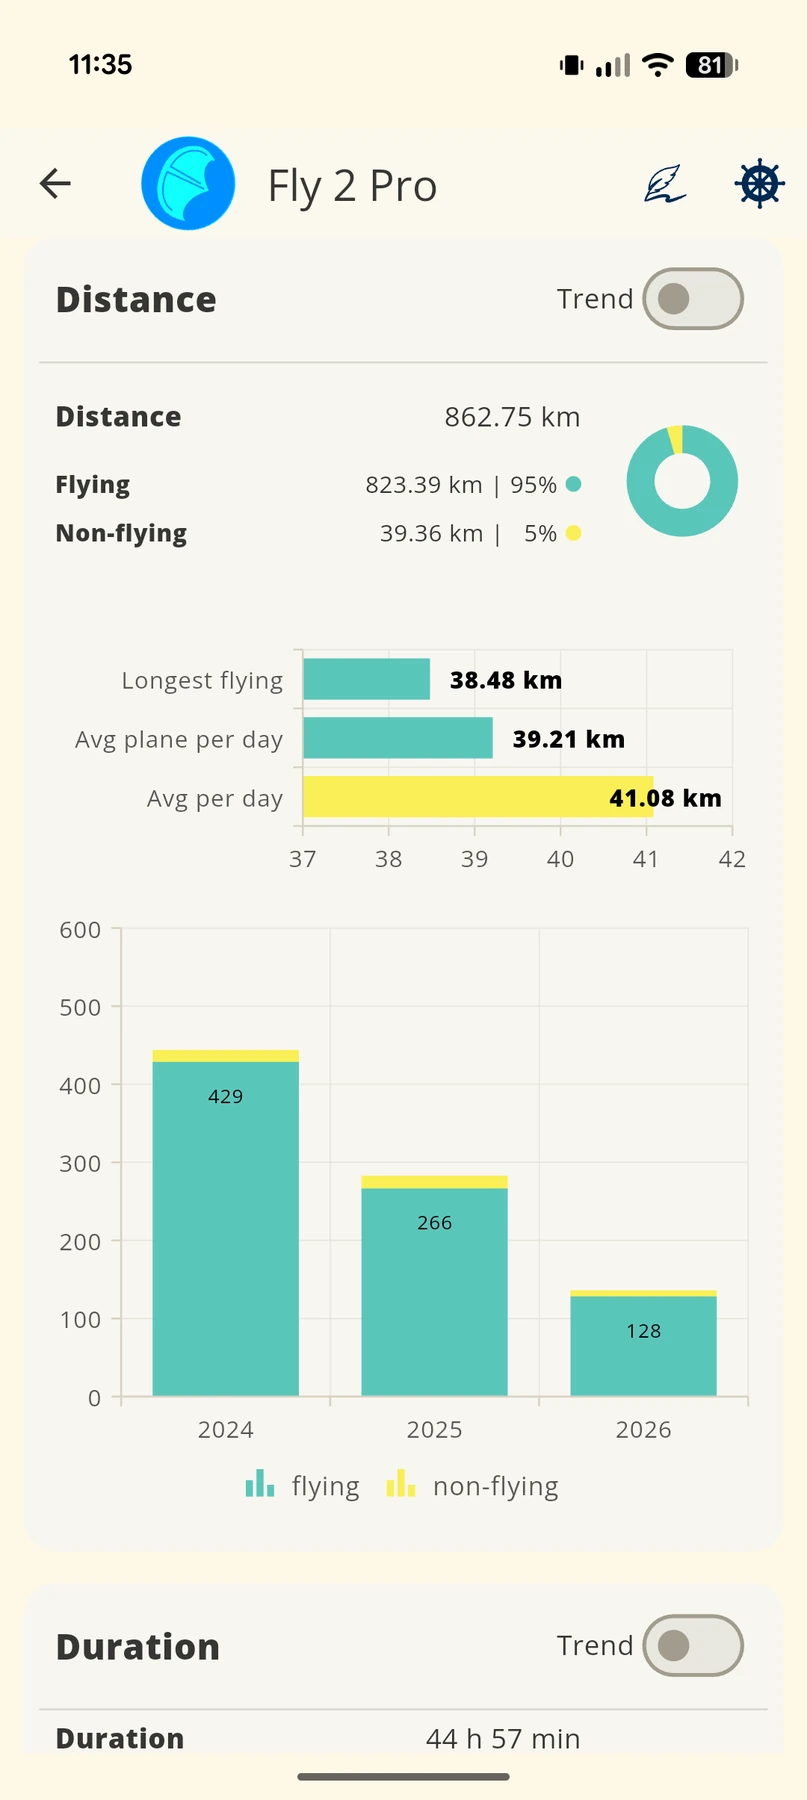
A single session depends strongly on wind, water, gear and form on the day. Progress therefore becomes reliable only across several sessions. WindSportTracker summarises your development by month, season and year and keeps wingfoil separate from kitesurfing or pump-foiling.
In the long-term view you see, for example, whether your flight ratio is rising, whether connected flight phases are becoming longer, and whether you foil jibes through more often on both sides. Together with the gear assignment you can place time spans and setups, instead of making one especially windy session the only benchmark.
For beginners the statistic documents the path from short first flights to longer controlled sections. Advanced riders see whether maneuvers end the flight phase less often. Experienced riders can follow how often they bridge weak wind phases and connect longer runs. The analysis therefore stays meaningful across different learning goals.
Screenshots from the analysis
The following views come from the app, not from a marketing render. Alt texts describe what you actually see after the session.
Frequently asked questions
Can I record wingfoil sessions without a smartwatch?
Yes. Android and iPhone are enough. A waterproof case and the phone in your pocket or harness pocket work for most sessions. The watch is optional.
What is the difference between flight time and session duration?
Session duration covers the whole recording. Flight time counts only the phases in which you foil. The flight ratio divides flight time by session duration. The app also distinguishes time and distance in displacement sailing as well as pauses, for example after a crash or while you wait for wind.
Does WindSportTracker detect foiling jibes and tacks?
Yes. The app distinguishes foiled-through, partially foiled and crashed maneuvers and evaluates port and starboard separately. 360s are recognised as their own maneuver, not as a tack or a jibe.
Do Garmin, Apple Watch and Wear OS work?
Yes. Apple Watch and Wear OS record directly with WindSportTracker. Garmin, Coros, Suunto and Polar transfer sessions automatically after a link. From further watches, for example Amazfit, Huawei, Xiaomi or Fitbit, you can import exported GPX files.
Can I compare wing, board and foil?
Yes. You can assign wing, board, mast, front wing, stabilizer and further freely defined components or settings such as shims. Borrowed and archived gear stays analysable in the matching sessions.
Where is the GPS data stored?
On servers in Germany under the rules of the GDPR. WindSportTracker does not share your data with third parties and shows no ads.
GPS on the foil: 1 Hz, outliers, real flights
Phones typically deliver 1 Hz GNSS; some watches record at a higher rate. WindSportTracker uses extra samples when the device supplies them, but it also has to derive reliable flight phases and maneuvers from a 1 Hz track. That is more demanding in wingfoiling than in sports where the board stays at a constant height on the water surface during the ride: the algorithm has to recognise changing riding states without interpreting a GPS outlier as a real transition.
The app does not directly measure the height of the foil above the water and it does not count touchdowns. It distinguishes flight and non-flight phases from the path of the track. That split then becomes the basis for flight time, maneuver and wave analyses.
Wet hands, neoprene, waterproof cases and recording with the display off affect the GPS data from which every later analysis is built. WindSportTracker has been developed for more than ten years for GNSS recordings on phones and watches. The analysis can therefore handle both a natively recorded track and an imported file and tell a foiling jibe from another course change.
Try WindSportTracker for wingfoil
27 days of full access on Android, iPhone, Apple Watch, Wear OS and on the web. No features locked, no payment details until you decide to continue. After that, when you pay via the web app, it costs €2.70 per month or €27 per year; store prices can differ. The amount can differ in other currencies and because of taxes.
If you also windsurf, the matching page is under windsurfing with GPS. Jumps and transitions are analysed separately in the kitesurfing sport.