Windsurfing app GPS tracking: every jibe, every planing phase
Updated on
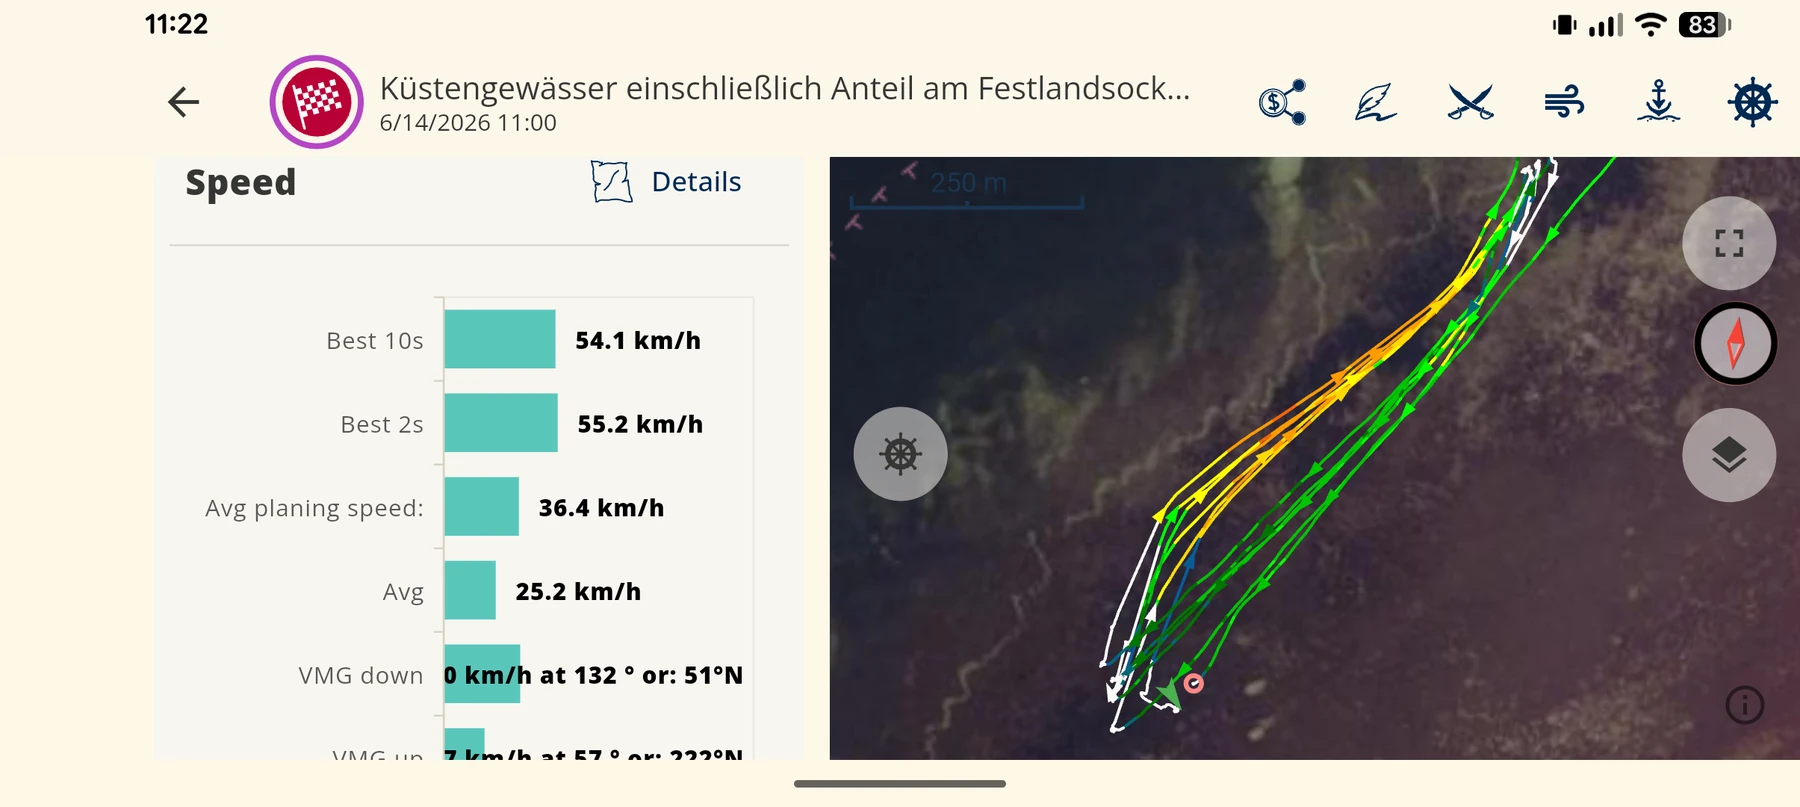
Windsurfing is more than planing and chasing the highest possible top speed. On the water the practical questions count: Do you make it through wind holes without dropping off the plane? Which angle to the wind actually gets you to the target fastest? And do your jibes succeed not just somehow, but planing through and reliably on both sides? WindSportTracker is a windsurfing app that makes those differences measurable, so you are not left with only the feeling after the session.
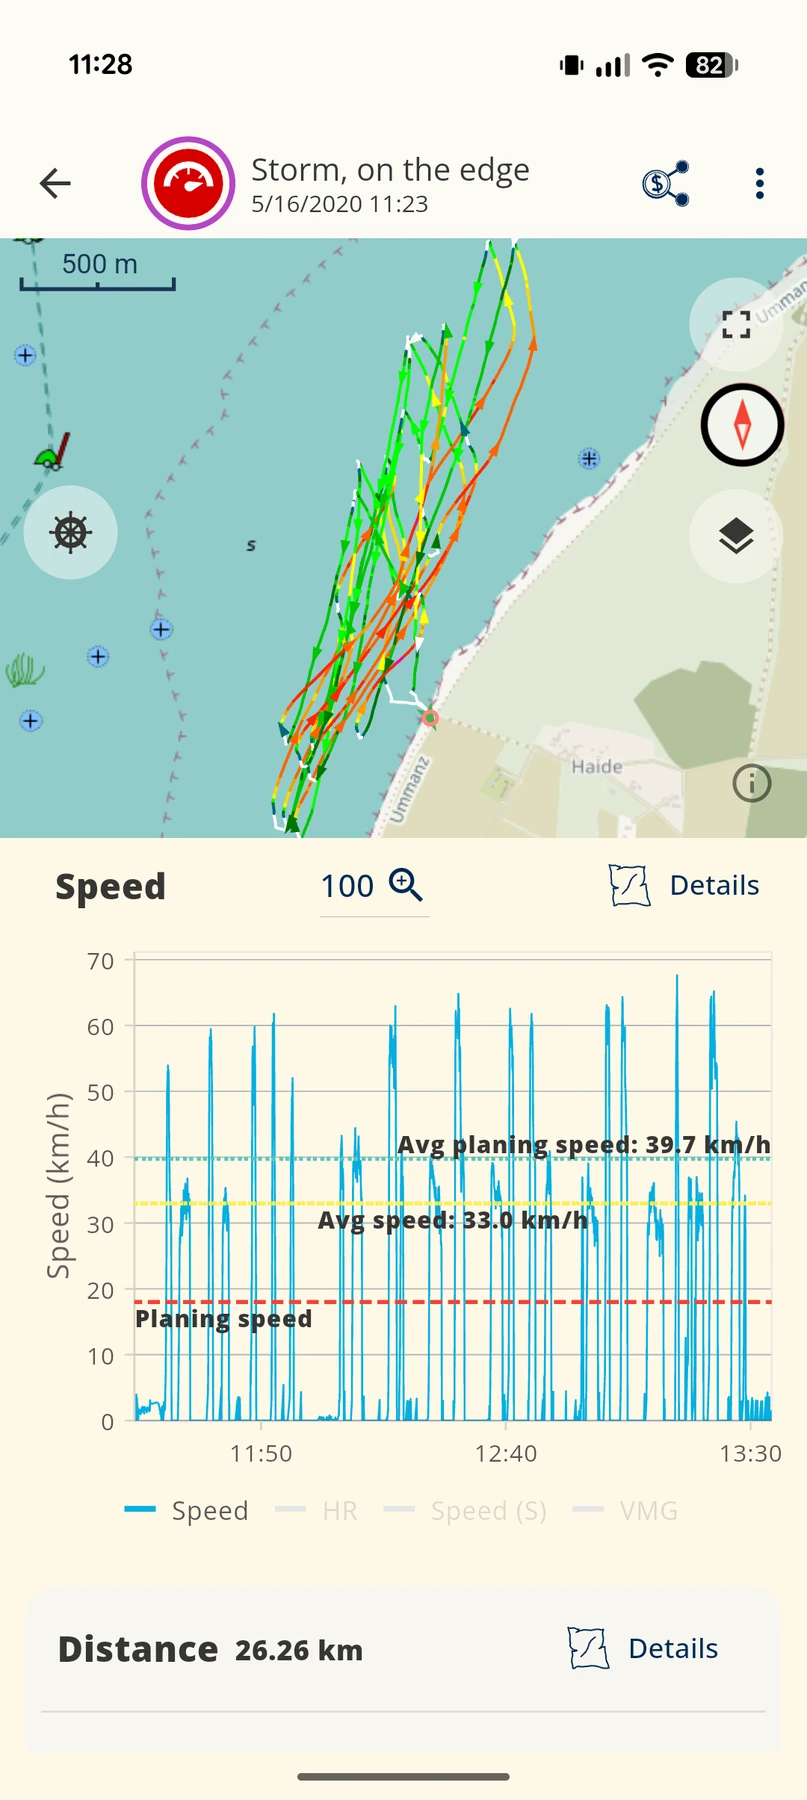
A mark on the map shows where you sailed, but it still does not explain why you lost speed at a particular place. In WindSportTracker you can select individual maneuvers, speed values and longer sections, highlight them on the speed-colored map and check them second by second in the zoomable speed chart. That way you compare two jibes or two courses directly with each other. Other apps often show analysis values only as lists; WindSportTracker makes every value selectable on its own and ties it to its exact path on the map and in the chart.
WindSportTracker is available as a subscription. During the 27-day trial the full feature set is open to you. That includes speed per side and section, upwind and downwind analyses, VMG, polar diagram, jibe and wave analyses. You can therefore check with real sessions whether the level of detail helps your training before you decide on the subscription.




What the windsurfing app measures
Every metric answers a different question. A short speed value shows your highest speed, but says little about how long you could hold it. A jibe rate shows how often you planed through, yet without a detail view it does not reveal where in the curve the speed was lost. WindSportTracker therefore connects measured values, map and time series.
Planing time and planing ratio
At the transition into planing, the windsurf board lifts largely out of the water. Above all the rear area around the fin stays in contact, while water drag and wetted surface drop clearly. The ride feels freer and faster than in displacement. This change matters more than an arbitrary knot limit set by the user.
The windsurf algorithm detects the transition from displacement sailing to planing. From that the app calculates both the total planing time and the planing ratio of the session. On a gusty day you can see whether you parked often despite good peak values. In similar conditions you can then compare objectively with which board, sail or course you planed better through wind holes.
Planing ratios become especially meaningful when you put comparable sessions or time spans next to each other. A high value on a steadily windy day is easier to reach than in holey wind. Map and chart therefore help you read the number in the context of the actual ride, instead of treating it in isolation as a grade of your technique.
Speed over 2 s up to long distances
The 2-second value is the smoothed top speed of a session. It is more meaningful than a single 1-second peak, which can be influenced by measurement noise. In addition the algorithm filters implausible GPS outliers. The displayed peak therefore stays close to the performance you actually sailed, without declaring a random single sample as a record.
After that it is about holding speed: How long can you keep a high speed? The analyses over 5 s, 10 s, 500 m and longer stretches look at increasingly different skills. A fast 2-second value can come from a single gust. Good values over 500 m need a matching course, lasting pressure in the sail and control over the board.
From about one kilometre an analysed section can already contain a maneuver. Then the result no longer depends only on straight-line speed. A jibe, a wind hole or a deliberate change of angle affects the average. In the speed chart you see whether the slower value came from the chosen angle to the wind, a short displacement phase, or the speed loss in the maneuver.
You can open every supported speed value on its own and compare it with other runs. That separates the question “How fast was I briefly?” from “How long could I hold this speed?”. The distinction helps both when you compare gear and when you train a stable riding position.
Alpha 250
Alpha 250 combines speed, course choice and maneuver quality. A valid run covers about 250 m before and 250 m after the maneuver, so around 500 m in total. Start and end may be at most 100 m apart. The value therefore does not reward any fast straight with a direction change afterwards.
The challenge already starts on the way out. If you only go as deep and fast as possible, the way back may become too long or too slow. If you choose an angle that is too tight, you lack speed for the jibe. A good Alpha run brings the outbound, a planing-through maneuver and the return into one shared balance. By highlighting the run on the map and in the speed chart you can compare two attempts and see whether the approach, the jibe or the acceleration afterwards made the difference.
Jibes, tacks and 360s
WindSportTracker detects jibes and tacks on the windsurf board and inspects their speed profile. For jibes the app distinguishes planing through, partially planing and not planing through. The general impression “The jibe was quite good” becomes a checkable development: you see whether you entered with enough speed, how much you slowed in the curve, and how quickly you accelerate again on the new tack.
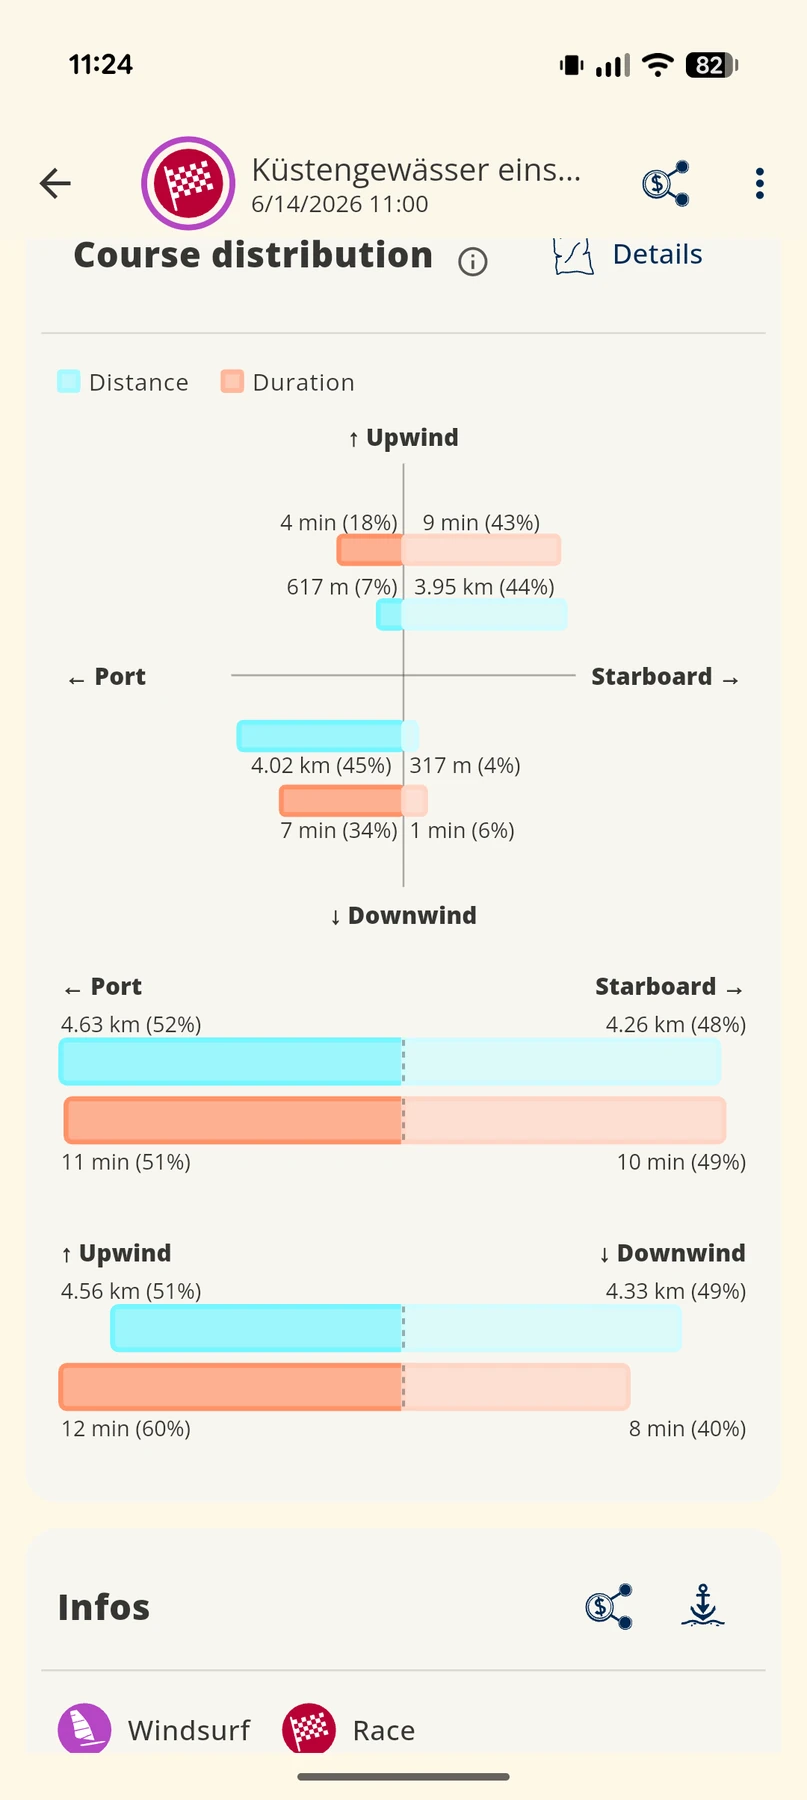
The separate analysis by port and starboard shows on which side your jibes succeed more reliably. A weaker side is not a flaw, it is a concrete training task. You can select matching maneuvers, locate them on the map and compare them in the chart with the stronger side.
When jibes and tacks become more secure, 360s are a possible next learning step. The same detail views help you find errors in the rotation: Where does the speed loss begin, how does the course develop, and when does pressure return to the sail? The analysis therefore builds on your current riding skill instead of folding every maneuver into a single number.
VMG and polar diagram
VMG describes the speed toward an imagined point exactly in the wind direction or against the wind direction. Because a windsurfer does not sail directly against the wind, and in practice also does not usefully sail exactly dead downwind, the target is reached by crossing upwind or downwind. The steepest course does not automatically win.
A slightly less steep angle can allow more boatspeed and therefore deliver the better VMG to the target. WindSportTracker compares crossing courses upwind and downwind and accounts for a shifting wind direction during the session. Runs are therefore not scored wholesale against a single wind direction that is already out of date.
Individual VMG runs are selectable. You can examine course angle, boatspeed and result together and find out which compromise works for you. The polar diagram visualises your performance across different angles to the wind. Shown as a wind clock, it also makes it easy to see on which courses you sail especially efficiently and where gaps remain.
Map, replay and speed chart
All analysis types follow the same principle. Whether distance, speed, VMG, maneuver or waves: the speed-colored map shows the spatial path. When you select a result, WindSportTracker highlights exactly the matching section. You do not have to guess from a long list at which place on the water the value was created.
In the replay you follow the ride along the track. The zoomable speed chart adds the time series to the map and allows a second-by-second check. On a jibe you see, for example, the approach, the lowest speed and the acceleration again. On a longer run you see whether a change of angle or a wind hole pushed the average down.
This analysis principle also applies to supported imports. An imported session receives the full windsport-specific analysis and is not reduced to a simple track display. That covers both files from specialised GPS devices and other supported formats.
Record and import
You decide which device fits you on the water. WindSportTracker separates native recording, automatic transfer from a manufacturer system, and file import. After the transfer the same windsport-specific analyses are ready.
- Garmin, Coros, Suunto and Polar: You record the activity in the respective manufacturer system. After a one-time link, new sessions are transferred to WindSportTracker automatically and evaluated with these analyses. Setup notes are in Garmin watersport tracking, Coros watersport tracking, Suunto watersport tracking and Polar watersport tracking.
- Apple Watch and Wear OS: The native WindSportTracker app records directly on the watch and transfers the session automatically. During the ride it gives spoken feedback and reports a new session top speed by vibration. A mini statistic also shows duration and distance of the current planing phase. More detail is in the Apple Watch guide and the Wear OS guide.
- iPhone and Android: Both platforms can record a session directly with WindSportTracker. Spoken feedback during the ride helps here as well, without you having to look at a display.
- Locosys GT11, GT31, GW52 and GW60: Speedsailors can import SBN and SBP files. After the import described in Locosys GPS import, all of the analyses above are available.
- Further formats: Other supported import formats also go through the same analysis process. What matters is not whether the session was recorded natively or externally, but that the track can be analysed in WindSportTracker.
Compare your gear
Windsurfing uses a setup of several components. In WindSportTracker you can capture sail, board, fin, mast and boom and link them to your sessions. Freely configurable components extend the gear system, for example mast extension, footstraps or other parts whose influence you want to watch.
Every linked piece of gear gets its own statistics. You can therefore check, for example, with which sail you get through wind holes more often in comparable conditions, or which board enables more stable speed values on long runs. The numbers do not replace the context of wind, water and riding skill, but they make recurring differences visible.
Labels help you group setups for particular conditions. Instead of searching every component one by one before the next session, you quickly find the combination you intended for gusty inland wind, strong wind or a speed day. Gear management therefore supports both the later analysis and the preparation at the spot.
Long-term analysis
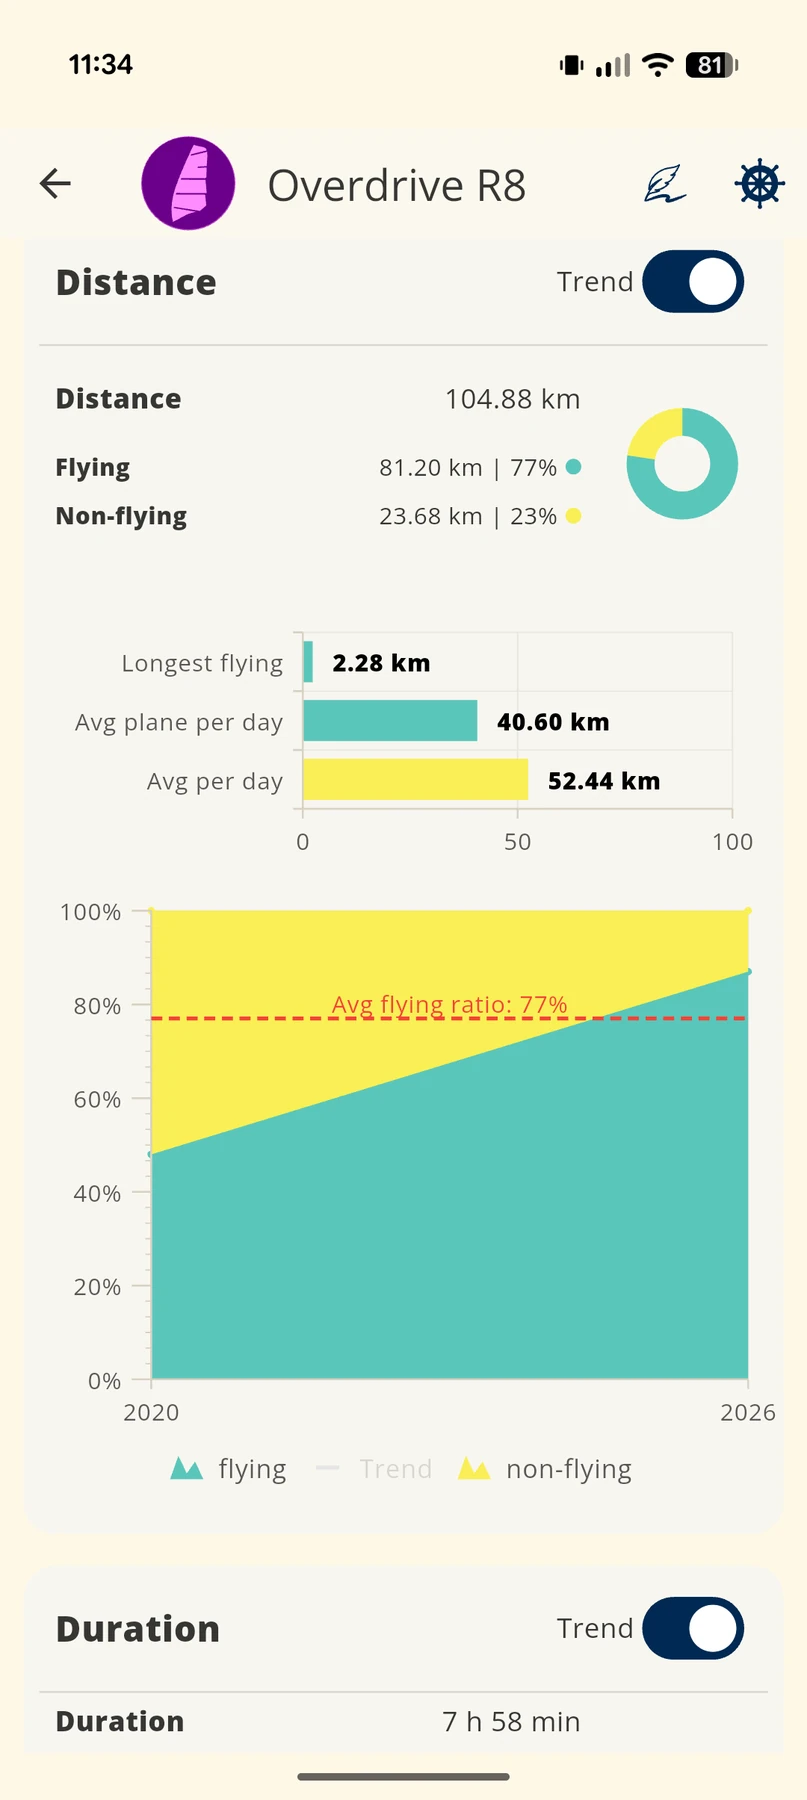
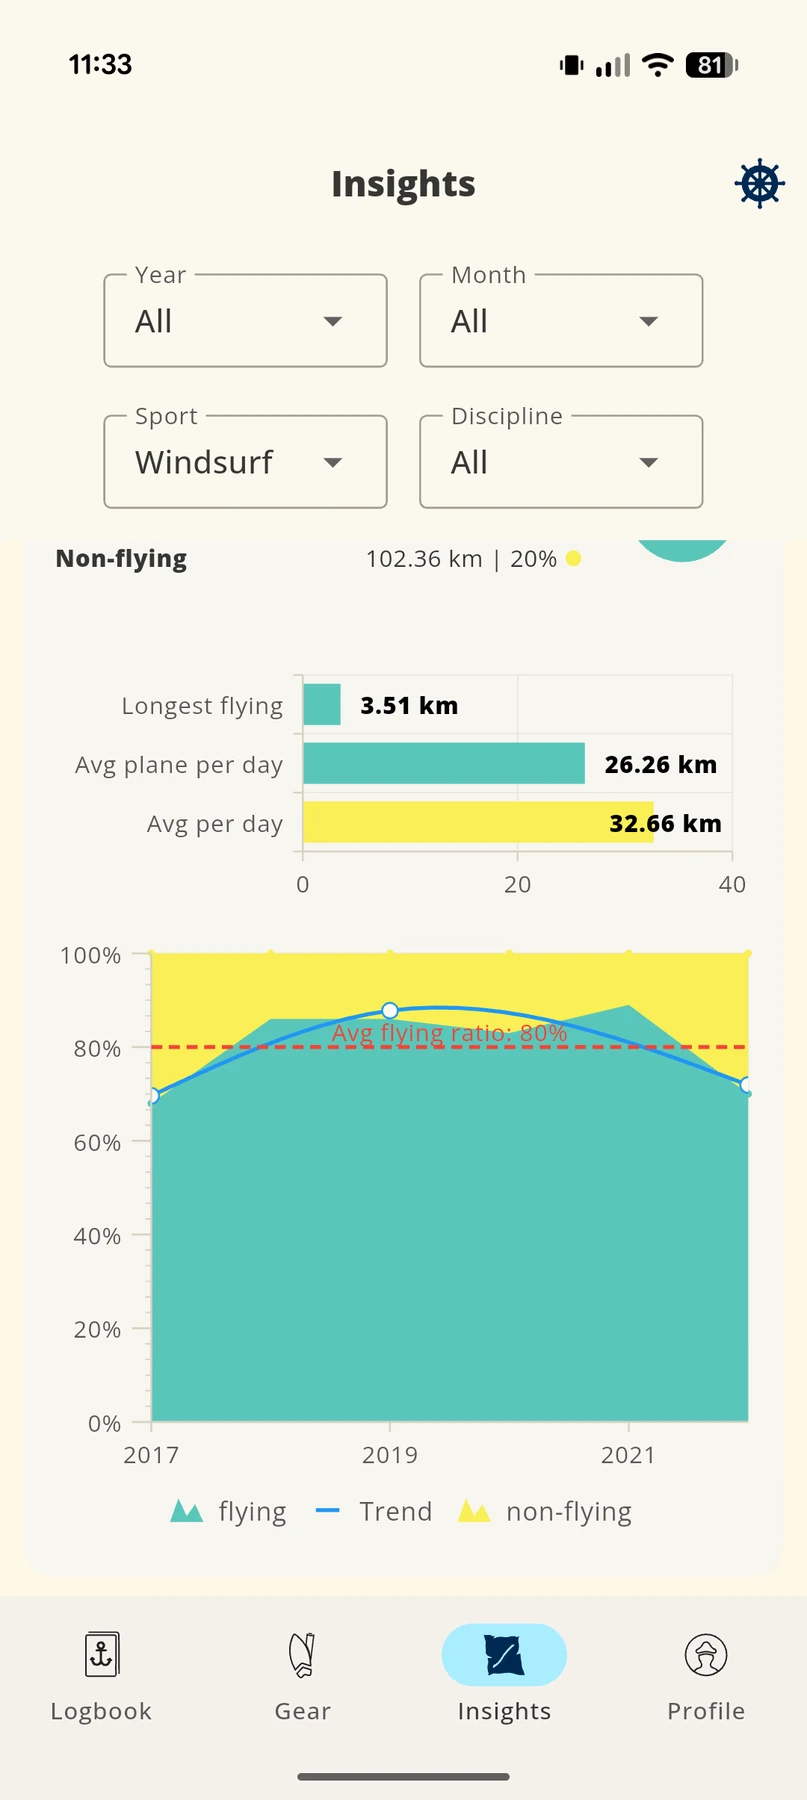
A single session is always shaped by wind and form on the day. The yearly overview instead shows how your windsurfing develops over many days. In the trend view you can follow planing efficiency and jibe rate in particular. Is the planing ratio rising in comparable conditions? Are planing-through jibes becoming more frequent on both sides? Such questions can be answered more reliably over months than right after a good or bad day.
That is especially helpful for recreational windsurfers who ride irregularly. When several weeks lie between two sessions, memories of wind, gear and maneuvers are often imprecise. The long-term analysis keeps the development and shows in which area training is working or is still needed. It replaces neither time on the water nor an honest look at the conditions, but it gives your impression a solid basis.
Screenshots from the analysis
Frequently asked questions
What is Alpha Racing 250 m and why is that not a top-speed number?
Alpha 250 covers about 250 m before and 250 m after the maneuver. The roughly 500 m stretch counts only when start and end are at most 100 m apart. Because the direction change, jibe and return together assess technique and course choice, Alpha 250 is not a pure straight top speed. More context is in the forum FAQs.
How does WindSportTracker tell planing from not planing?
An algorithm developed for windsurfing detects the transition from displacement sailing to planing. Planing time and planing ratio are therefore determined independently of a speed threshold you choose yourself.
How does WindSportTracker evaluate jibes?
The app distinguishes jibes that planed through, partially planed, and did not plane through, and it evaluates them by port and starboard. Once you have the jibes under control, you can study 360s as the next learning step with the same detail views.
Can I import GT31 or GW60 files?
Yes. SBN and SBP files from Locosys GT11, GT31, GW52 and GW60 can be imported. WindSportTracker then runs the full analysis of the imported track. A walkthrough is in Locosys GPS import.
Is there VMG even though the wind shifts during the session?
Yes. The VMG analysis compares crossing courses upwind and downwind and accounts for a shifting wind direction during the session.
Which devices can I use to record windsurfing?
iPhone, Android, Apple Watch and Wear OS record directly with WindSportTracker. After a link, Garmin, Coros, Suunto and Polar send their sessions to WindSportTracker automatically. The Garmin guide explains the connection as an example.
Speed sailing, freerace, waves — same app, different questions
Every windsurf discipline asks different questions, even when some analyses overlap. In speed sailing, short and long speed runs are at the centre. In freerace, course choice, jibes and holding speed also matter. In waves, the number, duration and distance of wave rides matter. Base values such as track, distance or speed stay shared, but the specialised analyses follow the chosen discipline.
A wave analysis appears only when a matching wave discipline was selected. Flat-water sessions are therefore not overloaded with unsuitable wave values. At the same time the discipline acts as a statistics filter. You can, for example, look at the speed analysis of your slalom sessions separately from pure speed runs, even though both use high speeds and partly the same intervals.
Spoken feedback supports decisions while you are still on the water. The announced speed shows you whether you have built enough speed for the next jibe. After a change of angle you hear whether the new course is faster or slower. In a gust you can judge whether falling off further and pushing is worth it, or whether your previous angle was already more efficient. The feedback therefore adds a direct response during the ride to the later detail analysis.
When you switch from fin to foil, you select Windfoil as the sport in the app. WindSportTracker then uses flight analyses instead of planing analyses, because a foil has different states and learning goals from a windsurf board with a fin. If you also ride a wing, you will find the matching metrics under wingfoiling. Devices and account can stay the same; the analysis follows the chosen sport.
Try WindSportTracker for windsurfing
During the 27-day trial you can use all described functions with your own sessions: native recording, automatic transfer, import, detail analysis and the long-term view. You are therefore not checking a demo, but your actual riding style, your gear and your preferred spots. After that WindSportTracker costs €2.70 per month or €27 per year when you pay via the web app. The amount can differ in other currencies and because of taxes.
Continue to wingfoiling if you want to analyse flight time with the wing, or to pump-foiling if you analyse flights without a wing.